The global steel industry is at a structural turning point in the second half of 2026, where the intersection of three key variables global overcapacity, changing consumption patterns in China, and carbon reduction deadlines (particularly Europe’s CBAM requirements) has transformed the geopolitics of this industry.
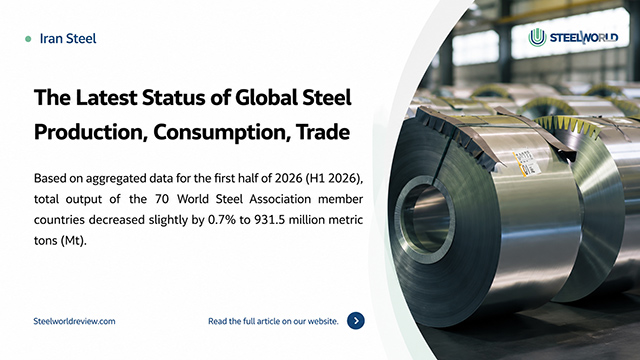
 1. Crude Steel Production According to aggregated data for the first 6 months of 2026, total production by 70 member countries of the World Steel Association reached 931.5 million metric tons, a slight decrease of -0.7%.
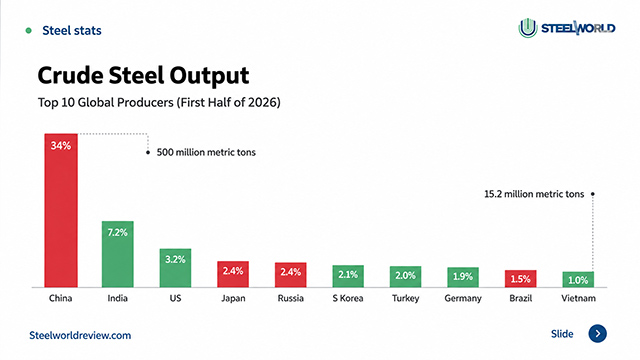
 Top 10 Global Producers (First Half of 2026):
 China: 500.0 million tons (-3.0%)India: 87.0 million tons (+7.1%)
 United States: 42.8 million tons (+6.3%)
 Japan: 40.4 million tons (-0.4%)
 Russia: 32.1 million tons (-8.4%)South Korea: 31.7 million tons (+2.1%)Turkey: 19.8 million tons (+8.1%)Germany: 18.6 million tons (+8.9%)Brazil: 16.3 million tons (-1.5%)Vietnam: 15.2 million tons (+26.9%)
2. Demand and Apparent Consumption Outlook  Global apparent consumption in 2026 is estimated at 1,724 million metric tons, with very mild growth of +0.3%. A return of demand to an upward trajectory is forecast for 2027, with 2.2% growth, relying mainly on the revival of infrastructure investments in Europe and North America. China’s consumption basket, despite the decline in the construction sector, is supported by growing demand in electric vehicles, solar grids, and wind turbines. The Middle East and North Africa (MENA) region, with annual demand of 55 to 60 million metric tons, is the most stable regional consumption market, thanks to development projects in the Persian Gulf region.
3. International Trade Balance (Exports and Imports) The continuation of China’s high export levels (exceeding 100 million metric tons per year) has led to intensified protective measures and tariff barriers around the world.
Largest Exporters: China: 102.5 million tons Japan: 32.0 million tons South Korea: 27.5 million tons Germany: 21.0 million tons Turkey: 14.5 million tons
 Largest Importers:
 European Union: 40.2 million tons United States: 27.5 million tons
 Germany: 22.1 million tons
 Italy: 20.8 million tons
 Vietnam: 16.2 million tons
 Supplementary Analysis and Strategic Outlook:
1.The Expiration of Traditional Advantage Price- and raw-volume-based competition in long construction sections has reached a dead end. Dumping resulting from China’s overcapacity has minimized the profit margins of traditional blast furnace (BF-BOF) plants in open markets.
2. Carbon Tax: A Gateway Filter for Access to Top-Tier Markets As the implementation stages of the cash penalties under Europe’s Carbon Border Adjustment Mechanism (CBAM) approach, products with emission intensity above 1.2 tons of carbon per ton of steel will lose their price advantage in European markets.
3. The Middle East’s Structural Advantages and Bottlenecks The region’s production reliance on Electric Arc Furnaces (EAF) and Direct Reduced Iron (DRI) has provided an inherent carbon-emission advantage (approximately 1.0 tons versus 2.2 tons for blast furnaces). However, maintaining this position is contingent on accelerating the sustainable supply of energy carriers, the use of high-quality scrap, and moving toward hydrogen to produce steel with less than 0.5 tons of carbon.
(The reason Iran does not hold the tenth position is that Vietnam’s total steel production in the first half of 2026 surpassed Iran’s. Vietnam, with recorded production of 15.2 million tons of steel, secured the tenth position on the list of the world’s largest steel producers.)